Data analytics services turn scattered business data into governed dashboards and reports leaders can trust. Consilien builds the secured data foundation first, the architecture, the integration, and the warehouse, then delivers Power BI and Microsoft Fabric analytics on top. The data stays current, access stays controlled, and the numbers stay AI-ready.
Data Analytics Services
Turn scattered ERP, spreadsheet, and CRM data into one trusted view your team actually makes decisions from.
You're not short on data. You're short on numbers you trust.
Most mid-market companies are not short on data. They are drowning in it.
The ERP holds one version of revenue. The warehouse management system holds another. Finance runs the real numbers out of a spreadsheet that lives on one person's laptop. Sales trusts the CRM. Operations trusts the floor. And when the leadership team sits down to make a call, half the meeting is spent arguing about whose number is right instead of deciding what to do.
That is the problem this page is about. Not "we need more reports." You have plenty of reports. You need reports people believe. Our managed IT team already runs and secures the systems that data lives in, which is why we approach analytics differently than a firm that shows up, builds a dashboard, and leaves.
A quick, honest note before we go further. We are an IT and data company. We benefit when you hire us to build this. So read the rest with that in mind, and hold us to the proof.
Why most dashboards cannot be trusted
Here is the pattern we see over and over.
A company buys Power BI, someone technical wires up a few connections, and for about a quarter it looks great. Then a field gets renamed in the ERP. A new product line does not map to the old categories. Somebody changes how returns are booked. Nobody updates the report. Three months later the dashboard is quietly wrong, and everyone knows it, so they go back to the spreadsheet.
The dashboard was never the problem. The plumbing underneath it was.
Gartner found that 80% of data and analytics governance initiatives will fail by 2027, largely because ownership is unclear and governance gets treated as an afterthought. That tracks with what we find on almost every first engagement. Nobody owns the definitions. "Active customer" means four different things to four departments.
One thing we see a lot. Leadership assumes the fix is a better BI tool. It almost never is. The fix is agreeing on what the numbers mean, connecting the sources properly, and putting someone accountable for keeping it true. Tools are the easy part.
So that is where we start. Not with a pretty visual. With the data that feeds it.
What we build
You do not need a data science department. You need decisions you can make on Monday morning without a two-day fire drill.
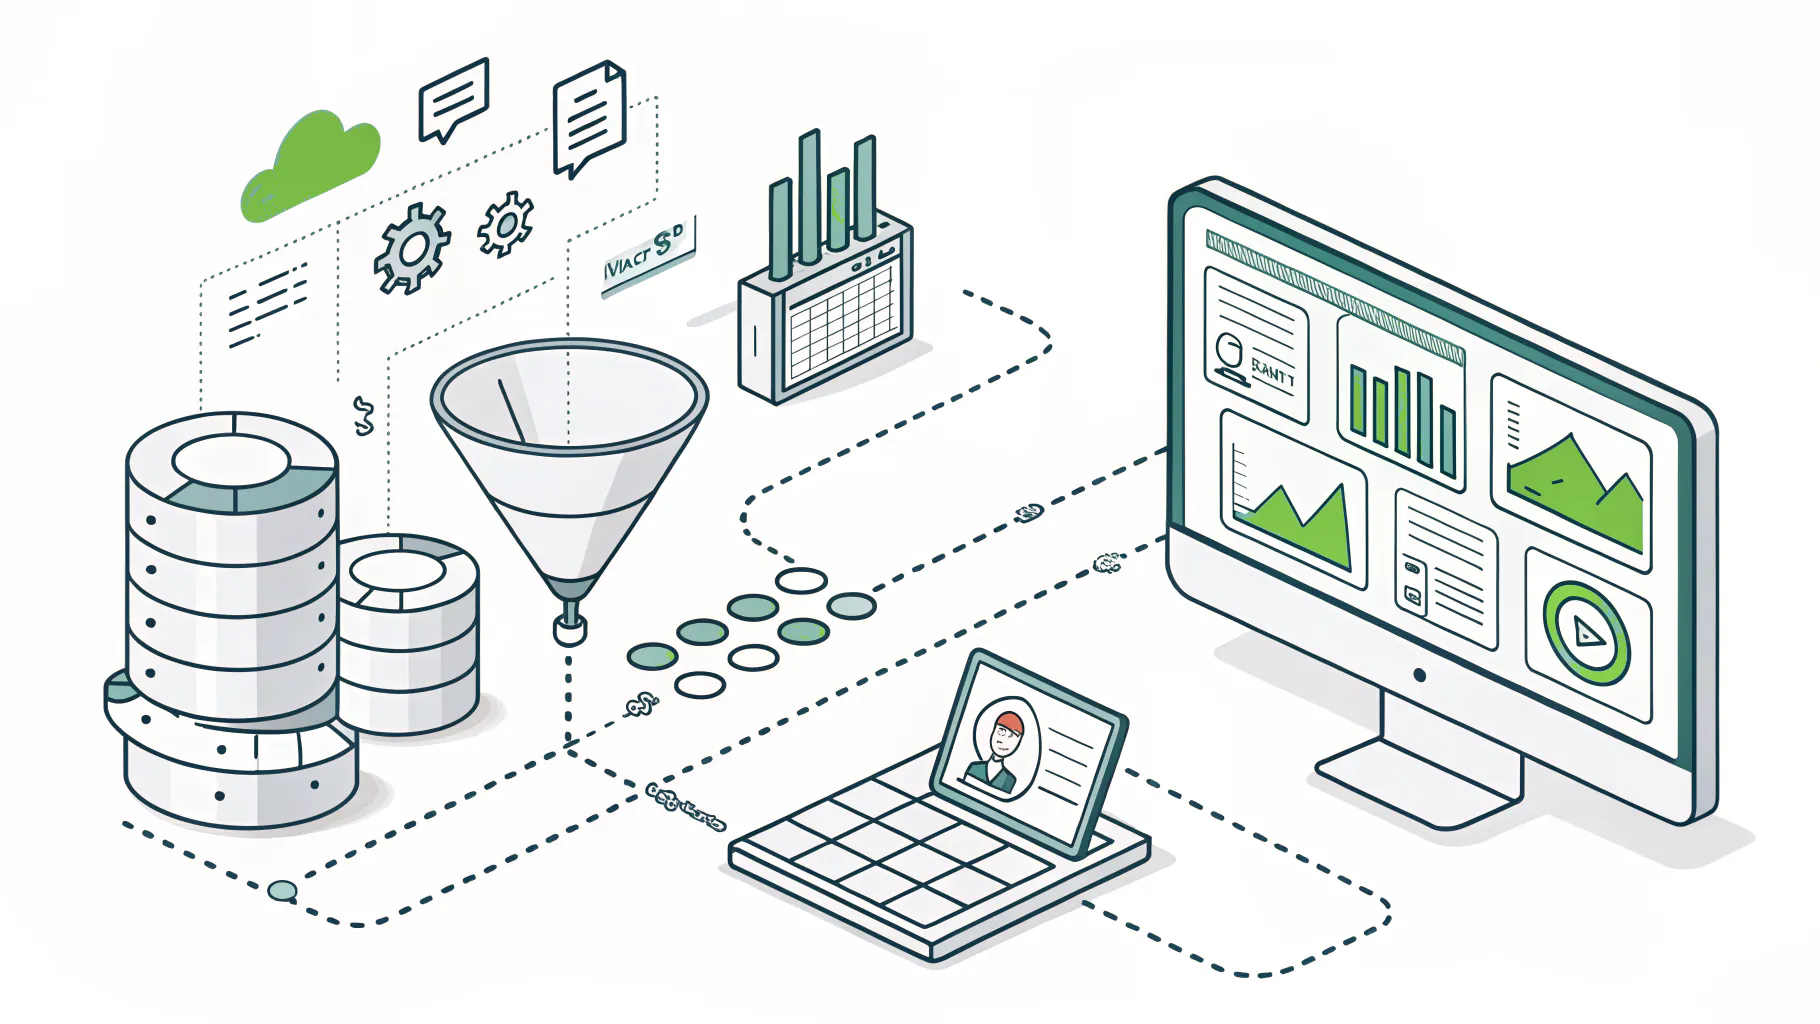
We build on the Microsoft stack, because most of our clients already live there. Power BI for dashboards and reporting. Microsoft Fabric and Azure Synapse for the engineering underneath. Azure Data Lake and OneLake as the single place your data lands. Dataverse and SQL Server where they fit. Fabric's OneLake connects directly to the systems you already run, including ERP, MES, IoT sensors, and CRM, so the data flows in without a rip-and-replace project.
If your world is not Microsoft, we work with what you have. We have pulled data out of NetSuite, QuickBooks, standalone MES platforms, and more homegrown Access databases than we would like to admit. The stack matters less than whether the pipes are reliable and the definitions are agreed.
What actually gets delivered:
- A single warehouse or lakehouse where your real numbers live, instead of six systems that half-agree
- Power BI dashboards built around the decisions you actually make, not a gallery of charts nobody opens
- Automated refreshes, so the report you open at 7am reflects last night, not last quarter
- Data integration that survives a field change in the ERP without silently breaking
Analytics on a secured, governed foundation
Now here is the part competitors skip.
A dashboard is a door into your data. Revenue, margins, customer lists, payroll, supplier terms. When a pure-play BI shop builds you a report, they are often creating a new copy of sensitive data sitting somewhere with permissions nobody has checked. We do not, because we are the ones responsible for your security posture in the first place.
We build analytics inside the same governed, access-controlled environment we already manage. Row-level security so the plant manager sees their plant and not the whole company's financials. Access tied to your existing identity setup. Data handling that lines up with the governance and compliance obligations your industry carries, whether that is CMMC for a defense contractor or SOC 2 for a professional-services firm. Compliance is its own engagement, not something we hand-wave into a dashboard project, but the two are built to fit together.
And because our vCIO team already sits in your strategy conversations, the analytics get pointed at questions that matter to the business, not vanity metrics that look good in a board deck and change nothing.
That is the difference between a report and a decision system.
Data-ready before AI-ready
Every leadership team we talk to right now wants to do something with AI. Fair. The pressure is real.
Here is the uncomfortable part. Gartner projects that at least 30% of generative AI projects will be abandoned after proof of concept by the end of 2025, and poor data quality is one of the top reasons. You cannot build reliable AI on data that four departments do not even agree on.
Clean, governed, well-modeled data is the thing that makes an AI initiative work later. It is also the thing everybody wants to skip. We would rather you spend three months getting the foundation right than twelve months explaining to your board why the AI pilot got quietly shelved. If AI is on your roadmap, this is the unglamorous work that decides whether it survives contact with reality.
What a data analytics engagement includes
Here is how a data analytics engagement actually works with us, and what is inside it. No mystery, no six-month discovery phase that bills by the hour.
What data analytics services actually are
Data analytics services are the design, integration, and reporting work that turns a company's scattered operational data into governed, trustworthy dashboards and metrics. That covers data architecture, moving data into a central warehouse, building visualizations in tools like Power BI, and setting the governance that keeps the numbers accurate over time.
Who this is for, and who it is not
You're a strong fit if you're a company between 20 and 500 users and any of this sounds familiar.
- Your data lives in three or more systems and no single view ties them together.
- Leadership meetings stall on whose number is right.
- You're a manufacturer, distributor, food processor, real-estate operator, or professional-services firm that runs on ERP, MES, or field data.
- You have got an AI or automation initiative coming and you already sense the data is not ready.
- You had a dashboard once, and it slowly died.
You're probably not the right fit if:
- You want a one-hour Power BI tutorial, not a built system. That is a class, not an engagement.
- You're pre-revenue and still figuring out what to measure.
- You're a healthcare provider. We do not serve that space, and we will say so rather than pretend.
- You want the charts but not the unglamorous data-quality work. That is where these projects go to die, and we will not skip it.
Before you decide
A few of the objections we hear most, answered straight.
Our data is a complete mess. Are we too early for this?
Backwards, actually. The mess is the reason to start, not the reason to wait. Almost every engagement begins with data that is scattered and inconsistent. Cleaning and structuring it is step one, not a prerequisite you have to finish alone first. If your data were already clean, you probably would not need us.
We already bought Power BI. Why pay for this?
Owning Power BI is like owning a table saw. Useful, and not the same as a finished cabinet. The tool draws charts. The value is in the data model, the governed pipelines, and the definitions underneath, which is the work that decides whether those charts stay right in six months.
How do we know this will not be another dashboard nobody opens?
Because we build around decisions, not data. Before a single visual gets made, we map the calls your team actually makes and the numbers those calls depend on. Dashboards die when they are built to show off the data instead of answer a question. We start from the question.
What does it cost?
Scoped to the build, with optional managed support after. It is a real range, and it depends on how many systems we are connecting and how rough the starting data is. We will give you a scoped number after the assessment, not a vague it-depends that never lands.
Full disclosure again. We are an IT and data firm, and we make money when you hire us for this. So take the numbers from Gartner and McKinsey, not from us. They point the same direction independently. If your leadership team cannot agree on last month's revenue without a two-hour argument, that is worth fixing regardless of who fixes it.
Common Questions About Data Analytics Services
How long before we see a working dashboard?
Weeks for the first useful views, not quarters. Most clients see initial dashboards inside 4 to 8 weeks, depending on how many systems we are connecting and the state of the data. The full foundation takes longer, and it is worth the wait.
Speak to a data expert about your reporting mess
Every quarter you run on numbers nobody trusts is a quarter of decisions made half-blind. That is margin you cannot get back. If you are ready to make calls from data instead of arguments, let us talk.